A Complete Guide To Churn

Knowing how to prevent and reduce your churn (attrition) rate is the most effective way to increase customer retention, loyalty, and satisfaction.
In this complete guide, you will learn everything you need to know about the churn rate, including how to assess the optimal churn rate and access our churn rate calculator. You will also discover many proven opportunities, including churn surveys and win-back strategies, to prevent and reduce your attrition rate.
Table of Contents
- What is the customer churn rate?
- Churn rate calculator
- Monthly versus annual churn rate
- Maximise customer retention and expansion
- How to better understand and reduce customer churn
- What, when, and how to use churn surveys
- Predicting customer churn
- Win back strategies to reduce churn rate
- Final note on customer churn
Try Questback 14 days for free.
What Is Customer Churn Rate?
Churn rate, sometimes known as the attrition rate, is the key metric to calculate the percentage of customers a business loses over time.
Lost customers refer to customers who cancel or fail to renew or revisit your service or product over a specific time period – per month, quarter or year.
Research shows that businesses need to keep a close eye on their churn rate and its causes and consequences, to maintain a healthy growth rate over time.
Churn Rate Calculator
Now that we’ve established it’s important to calculate your churn rate, you need to know three things before calculating you churn.
- The relevant time period: monthly, quarterly, or annual.
- The number of customers you had at the start of the time period.
- The number of customers you lost or churned over the time period (Customers Start of Time Period – Customers End of Time Period).
(Lost Customers during Time Period ÷ Total Customers at Start of Time Period) X 100
Given this formula, you can either calculate your own rate, or use our calculator to discover your churn rate quickly and easily:
Calculate your churn rate
Try different input values and see the impact on your churn rate.
If you churn the same percentage of customers each month:
If you churn the same number of customers each month:
As customer retention should be a critical focus, we highly recommend knowing both your monthly and annual churn rate, as the monthly attrition rate alone can be deceptive.
Monthly versus Annual Churn Rate
If asked, “would you be happy with a monthly churn rate of 5%?” many businesses often say yes. Product managers know that some attrition is inevitable, and a 95% monthly retention rate sounds high. Yet we need to be cautious—a 5% monthly churn rate compounds over time.
If your business loses 5% of its customers each month, this results in an annual churn rate of 43%. But if you were asked, “would you be happy with an annual churn rate of 43%?” you would likely answer no. Yet it’s the same question except for the time frame.

An annual churn rate of 43% doesn’t simply mean a loss of income. It also demands an increase in customer acquisition costs to replace the customers who ended their relationship with your business. This is expensive—research states it costs anywhere between 5 to 25 times more to acquire a new customer than to retain a current one.
So, if a 5% monthly churn rate isn’t ideal, what is the optimal churn rate?
The optimal churn rate depends on several factors, such as your business model and industry. To find your optimal churn rate, we recommend four steps:
- Measure churn rate at regular intervals that make the most sense to your business model, e.g., subscription, ad sales, renewal period.
- Compare your churn rate to industry benchmarks.
- Track your customer acquisition costs (CAC) to understand the impact of current and predicted churn rates.
- Calculate the impact in terms of income and CAC to understand a % change, for better and worse, in attrition rate.
To improve your churn rate, that is, to maximise customer retention, you need to strategically focus on customer retention to prevent customers from churning in the first place. Simultaneously, you will benefit enormously from using churn surveys to reduce your future churn rate. We now address both strategies in turn.
Maximise Customer Retention and Expansion
To sustain growth, you need your existing customers to renew and expand their business with you—this increases customer lifetime value. Highly satisfied customers will also refer new business—this decreases customer acquisition costs. Proactive customer insight is key to both customer retention and expansion. Here are five insightful tips for retaining and growing your customer base.
- Start gathering customer insight early
It’s never too early to gather customer insight. Whether your customers initially join you online or offline, once in your marketing database, you can deliver and track communications. By collecting, segmenting, and analysing data, you will quickly understand which customers are most responsive. Then you can communicate when, how, and where that most satisfies customers. Unresponsive customers also provide an early signal of potential churn. - Build data-driven campaigns to maximise valuable customers
Once acquired and tracked, you can maximise the value of your customer insight by building data-driven campaigns to retain and expand customer value. Consider deep personalisation using segmentation insights, as well as offering relevant incentives or discounts, where appropriate. With the right customer insight, you can develop the right messaging for the best effect—driving value. Trust builds when customers are treated differently and responsively. In turn, trust increases loyalty and customer spending. - Measure customer loyalty
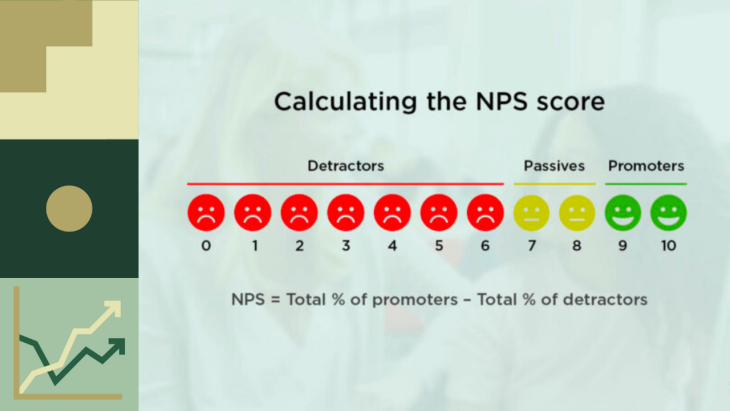
Stay in dialogue and learn through your customers by measuring your Net Promoter Score (NPS). Measured from -100 and 100, NPS lets you discern the proportion of customers who would recommend your organisation to a friend or colleague. Better still, you can choose when to measure your NPS score. At Questback, you have the option to make your NPS either (1) touchpoint/trigger-based, e.g., customer purchase, completing a support case, (2) Recurring, e.g., bi-annually, or (3) Ad-hoc, e.g., to a specific customer segment. Either way, knowing your NPS score, over time, delivers a distinct competitive advantage as it’s a window of opportunity to act and respond to customer needs. - Act on your customer data
Customer data are only valuable if you do something with the insight. To increase customer retention and expansion, it’s worthwhile putting in place the right systems to respond quickly and effectively to customer needs. For instance, via customer insight, you may discover that your customer funnel may be ‘leaky’ at certain touchpoints. By way of example, upgrade promotions may lack the right persuasion, or slow response times are putting off customers. With valuable insights, you can continually improve the whole customer journey to increase customer retention and expansion.Yet while there is much a business can do to improve and increase customer retention and expansion, you can reduce your churn rate even further if you understand why customers are leaving.
How to Better Understand and Reduce Customer Churn
There are three key strategies that your business can implement to understand the causes of customer attrition better. If you understand why customers are churning, this helps prevent future churn. These three strategies, discussed in-depth next, involve:
- Using churn surveys
- Predicting customer churn
- Winning back customers
What, When, and How to Use Churn Surveys
Churn surveys typically involve a small number of relevant questions when a customer decides to cancel or downgrade their relationship with your business.
Also known as exit surveys, churn surveys gather vital insights into why customers churn. With this data, you can identify what causes churn. In turn, this highlights how to prevent or reduce churn moving forwards.
The ideal time to deploy a churn survey is when the customer makes the decision— for instance, the user clicks a cancel button. Here you can provide customers with the opportunity to change their minds. For instance, you can allow customers to pause their accounts rather than cancel completely. This often works well if a customer wants to reduce costs temporarily, is too busy, or their use of your service is seasonal.
If pausing isn’t feasible for the customer and/or your particular business, the next best option is to follow up promptly with either an in-app or email churn survey. However, whether lost customers are happy to respond will depend on your churn survey’s effectiveness.
How to Reduce Your Churn Throughout the Customer Journey
Do you want to create an excellent customer journey? Gain competitive advantages, increase profits, and reduce your churn?
How to use churn surveys
If a customer chooses to cancel, it’s more important than ever to be friendly, understanding, and supportive. To compel lost customers to respond, you need to use the right tone of voice when inviting responses and framing questions.
For example, “We’re sad to see you go.”
The churn survey length also needs to be “just right”. Too long, and you risk causing frustration; too short, and you’ll miss vital insights. Therefore, it’s essential that you ask the most relevant and insightful questions.
How you structure questions is also an important consideration. For instance, a multiple-choice survey question is easy to respond to and taps into the most pertinent aspects of the product or service on offer.
For example: “Why did you decide to cancel your subscription?”
Potential response fields are: (1) I am not using the product enough, (2) It’s too expensive, (3) I’m switching to a different provider, (4) It’s too difficult to use, (5) I didn’t get the results I wanted, (6) I no longer need the product, (7) I need extra features.
You could also use conditional logic to probe the response(s) further. For instance, if (3) above, you could ask: “Which of the following providers are you switching to?”
At Questback, we also recommend including an open-ended churn survey question. This question format, for example, “Is there anything else you want to share?” allows customers to elaborate and provide context behind their decision to cancel.
And as with all customer insight, it’s important to act on your data when you receive it. If pricing keeps coming up as an issue, your prices may need reappraisal. Or, if technical issues are driving away customers, redevelopment may be called for. All told, churn surveys can significantly decrease your churn rate if the underlying causes are identified and acted upon.

Predicting customer churn
Up to this point, we have focused on finding out what is happening now, e.g., the current level of customer loyalty, and what has happened in the past, e.g., why customers chose to leave. However, it’s also important to look to the future— prediction.
While we should not overlook the famous quote, apparently of Danish origin, that “prediction is very difficult, especially if it’s about the future”, it’s a very useful tool, if used well, to reduce churn rate.
The key to valuable predictions is the type and value of the customer insight data you already have. If you follow the advice recommended here, you will have a significant amount of data to predict and explain churn.
Let’s recap what customer insight data you could use.
Firstly, you will have churn rate data at your disposal. This is your dependent variable—what you are trying to predict. Even better, you could carve up your data into different segments. With this approach, you could find out what predicts the churn rate for specific market segments, as there may be significant differences.
Secondly, you will have several independent variables. For instance, NPS scores, churn survey data, and any other market research survey data you have collected over time. You could also supplement this customer insight with data you collect during product/service usage, e.g., how often customers login, or other relevant engagement level data.
Lastly, when armed with the right kind of data, you can predict when and why churn occurs. As prevention is always better than costly interventions, prediction allows you to intervene before churn occurs.
Yet even when churn inevitably occurs, you can still implement a win-back strategy to reduce your churn rate even more.
Win Back Strategies to Reduce Churn Rate
There are three windows of opportunity best suited for winning back customers— before, during, and after the cancellation event.
Winning back existing customers
Not all customers are happy. When you measure your Net Promoter Score (NPS), you will discover what proportion, if any, are detractors. Detractors are still customers, but their loyalty has either waned or been lost. Equally, if you run predictive analysis on your customer insight data, you will likely discover other early warning signs of potential attrition. This is the time to win back customer loyalty.
There are several win-back strategies you could adopt:
- Personalise at every opportunity—email content, app greetings, curated web content.
- Reiterate your value proposition—gently remind your customers what you can do for them as they may not know the full extent on offer.
- Reward loyalty—make exclusive offers, award points, offer free gifts
- Be responsive—at Questback, our NPS is complemented by an open-ended question. Mining and responding to these generated insights isn’t enough, though. It’s important to let your customers know with a “you said, we did” to show you value their needs.
Try Questback 14 days for free.
Winning back exiting customers
Allowing your customers to pause their account is one win-back strategy, but don’t overlook other strategies.
Don’t miss the opportunity to:
- Say thank you—show your cancelling customers that you genuinely value their business.
- Apologise—if the cancel churn survey indicates a real problem, it’s important to say sorry. A genuine apology often diffuses a problem and sometimes even repairs a cancellation.
- Follow-up—high value customers who cancel are best followed up personally.
- Offer reassurance—the door is always open to your lost customers. A cancelled customer doesn’t mean forever cancelled.
Winning back lost customers
It’s never too late to win back lost customers. However, be strategic—not all customers are created equally. Focus your win-back efforts on the “best” lost customers.
In terms of tactics, consider:
- Time your win-back carefully—If you approach too soon, you may lose respect; if you seek reconnection after too much time, you may be forgotten. We recommend reconnection between 20 to 30 days, although it’s best to experiment to discover the optimal time for your particular business.
- Segment and target—customers don’t churn for the same reasons. If your churn survey is set up as advised above, you can tailor your reconnection message to the specific cause.
- Keep in contact—unless your customer has unsubscribed from your newsletter, keep sharing news and updates. Something new could well spark a customer to rethink, and return.
Final Note on Customer Churn
No business wants to lose customers. Yet despite its inevitability, our complete guide to customer attrition demonstrates that your business can take tangible steps across the whole customer lifecycle to prevent and reduce churn. Customer insight is the best approach to maximise customer retention.
FAQ
Churn rate is the key metric to calculate the percentage of customers a business loses over time. It is calculated by dividing the number of lost customers during a time period by the number of customer at the beginning of the time period and multiply the number by 100.
An example of churn is if a company start a quarter with 100 customers and end with 95, then the quarterly churn rate is 5% because the company lost 5% of the customers.
The ideal time to deploy a churn survey is when the customer makes the decision— for instance, the user clicks a cancel button. Here you can provide customers with the opportunity to change their minds.
Try Questback
Questback is a leading Customer and Employee Experience solution that makes it easy to collect, analyse and take action on key stakeholder insights.