CSAT you can trust and act on

CSAT tells you how satisfied your customers are right after an interaction. It helps you collect the score at key moments, close the loop with customers, and show the impact on revenue and retention.
CSAT stands for Customer Satisfaction Score. It measures satisfaction with a specific interaction. A CSAT survey asks a brief question such as How satisfied were you with your experience, plus an optional comment. Responses use a 1 to 5 or 1 to 7 scale, and the result is the share of top box answers reported as a percentage.

CSAT is suited to operational touchpoints like support closure, delivery, onboarding, or key in product tasks. Track results by channel, segment, and journey stage to see trends and detect issues early. You can combine scores with comments to find drivers and prioritise the next improvements.
Table of Contents
What CSAT means
CSAT stands for Customer Satisfaction Score. It measures how satisfied a customer feels with a product, service, or interaction, usually on a 1 to 5 scale or 1 to 7 scale, where the top boxes count as satisfied.
How CSAT is calculated
CSAT percentage equals the number of satisfied responses divided by total responses, multiplied by 100. Example: If 320 of 400 respondents chose 4 or 5 on a 1 to 5 scale, CSAT is 320 divided by 400 times 100 which equals 80 percent.
When to use CSAT
What gets measured gets managed. Use CSAT at moments of truth where a quick satisfaction read guides action. Use it to put the spotlight on whatever needs to be improved in the organization, or where quality must be upheld.
- After a support ticket closes
- After delivery or onboarding completes
- After a key in app task
- After a sales demo or renewal decision
Try Questback 14 days for free.
CSAT vs NPS vs CES
CSAT measures satisfaction with a recent experience and is best for fast operational fixes.
NPS measures likelihood to recommend and is best for relationship tracking over time.
CES measures effort to get something done and is best for diagnosing friction.
Want to learn more about NPS surveys? Read more in our guide about the Net Promoter Score
The right CSAT question and scales
Keep the core question simple: How satisfied are you with your recent experience
Follow with one or two diagnostics. Examples:
- What is the main reason for your score
- What could we improve next time
Use 1 to 5 or 1 to 7 with clear labels. Count the top boxes as satisfied.
Where to place the CSAT survey
Place the CSAT survey in the same channel as the interaction so feedback reflects the exact context. Use multiple channels only when they mirror where interactions happen or help you reach different users, and tag each channel so you can compare results reliably.
Web and app in a lightweight modal after a task completes
Email within 5 to 30 minutes after a case closes
QR code on delivery notes or receipts
Embedded in help center or chatbot flows
Distribution and timing
Send the CSAT survey in the same channel and as close to the interaction as possible. In app prompts work immediately after a task completes. For email, trigger within 5 to 30 minutes after a case closes so the experience is fresh but not disruptive. For deliveries or onboarding steps that unfold over days, wait until the step is complete and the customer has had a chance to use the result.
Respect customer schedules. Use local time zones and send during business hours for B2B audiences. Cap invitations so each customer receives only one CSAT per touchpoint within a set window to reduce fatigue. Keep the response window open for 24 to 48 hours, then close the survey to keep data tied to the event. If you use reminders, send one gentle reminder within the window and avoid repeating if the customer has already responded.
Sampling and representativeness
Your goal is to collect feedback that mirrors the interactions you actually have. Use event based sampling that is independent of outcomes. In high volume flows, invite a random fraction of users or every nth interaction. Cap invitations so each person receives one CSAT per touchpoint within a set window to reduce fatigue and keep observations independent.
Check whether respondents look like the invited population. Track response rate and mix by channel, customer segment, device, language, and time of day. Compare the respondent mix to your traffic mix. If you see skews, adjust the sampling rules or timing rather than relying only on weighting. If you must weight, use simple inverse probability weights and report both weighted and unweighted results.
Aim for enough responses to make trends stable. As a rule of thumb, about 400 responses per touchpoint give roughly plus or minus five percentage points margin of error at 95 percent confidence for proportions near 50 percent. About 1,000 responses reduce that to about three points. Use consistent weekly or monthly windows, set minimums before segment breakouts, and combine thin segments until they reach a reliable count.
What to do with the CSAT results
To make sure the survey leads to change in your organisation, you need to close the loop fast. Turn low scores into tasks with owners and due dates. Trigger alerts for very low scores.
You should also boost customer loyalty by thanking satisfied customers, then invite reviews or referrals when appropriate.
What to track in your CSAT dashboard
You conduct CSAT surveys to drive necessary change in your organization. This requires that each answer has a recipient in your organisation, someone who can act if the score is low. Your CSAT dashboard should therefore show the following:
- CSAT by channel and touchpoint
- CSAT by customer segment and product area
- Volume and response rate
- Top drivers from comments and tags (see explanation below)
- Trend lines week over week and month over month
What are Top Drivers in a CSAT?
“Top drivers” are used when analysing the results of a CSAT survey. They are simply names or tags that you assign to topics that appears again and again in the comments field of the survey. These tags will let you see which customer comments that most strongly explain highs and lows in CSAT.
A practical approach to handling Top Drivers when analyzing CSAT results
-
Create a clear tag set and apply it to every comment, manually or with text analytics.
-
For each tag, compare its average CSAT and the share of low scores against the overall baseline.
-
Rank tags by impact, not just frequency, so you see which issues move the score the most.
Example
If comments tagged with “delivery time” average 3.2 while your overall CSAT is 4.3, that tag is a negative driver. If “agent clarity” averages 4.8 and appears often, it is a positive driver worth amplifying.

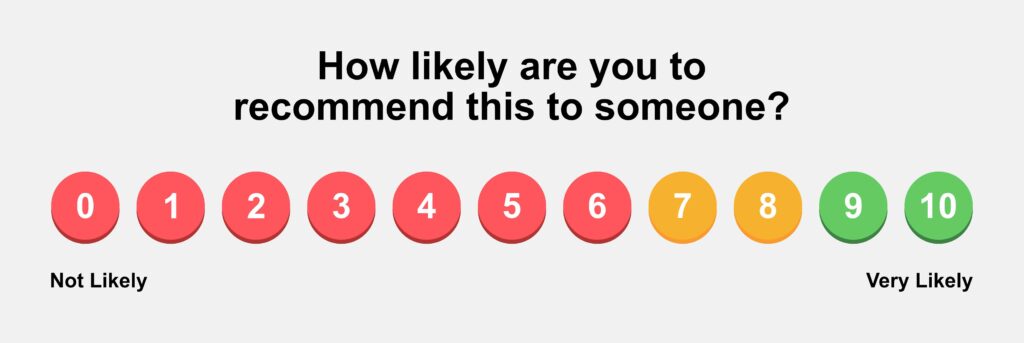
What is wrong in the picture above? Answer: The scale is off for a CSAT survey. Always use 5 or 7 options. Once you have chosen one of them, stick to that option, for tracking purposes.
How Questback supports CSAT
Ready to launch
Questback provides a library of CSAT questions and templates so you can start without building from scratch. Surveys inherit your brand through configurable themes, and multilingual options cover both left-to-right and right-to-left languages.
Smarter analysis
Comments are grouped into themes with text analytics, which makes it easier to see why scores move. You can filter results by channel, segment, and journey step, and compare periods side by side to check whether changes are holding.
Operate with confidence
Data processing follows GDPR requirements and runs in EU data centers. Access is controlled with roles and SSO, and activity is recorded through audit logs so administrators can review who did what.
Human support when you need it
Local specialists help with onboarding and ensure the first surveys measure the right touchpoints. Periodic reviews share good practices and highlight opportunities to improve. For larger programs, a managed service can handle setup, monitoring, and reporting.
Step-by-step instruction on how to drive ROI using CSAT surveys
Step 1 Define clear cohorts
Group customers by recent CSAT band and the same interaction type. Keep the time frame consistent.
Why this matters: it isolates the relationship between satisfaction and outcomes by reducing noise from mixed contexts.
Step 2 Choose outcomes that money cares about
Pick renewal, repeat purchase, upgrade rate, or average order value for revenue. Pick escalations, repeat contacts, returns, or handle time for cost.
Why this matters: you tie CSAT to metrics that leaders track and fund.
Step 3 Set a clean baseline and window
Record cohort outcomes before changes. Then observe outcomes for a fixed period after the survey such as 30, 60, or 90 days.
Why this matters: it limits reverse causality and seasonal effects so comparisons stay fair.
Step 4 Compare outcomes across CSAT bands
Calculate the difference in renewal rate or ticket volume between high CSAT and low CSAT cohorts.
Why this matters: the gap is your estimated impact associated with higher satisfaction.
Step 5 Translate the gap into money
Revenue impact equals uplift in rate multiplied by customers affected multiplied by average revenue per account multiplied by gross margin.
Cost impact equals reduction in events multiplied by unit cost per event.
Why this matters: finance-ready numbers turn insight into decisions.
Step 6 Attribute the change to what you did
Pilot the fix in one channel or segment and keep a similar group as control.
Why this matters: controlled comparisons separate correlation from causation.
Step 7 Track trend and explain drivers
Monitor the cohorts over time and link movements to tagged comment themes such as delivery time or agent clarity.
Why this matters: you prove the effect lasts and you show what to scale next.
Worked example
Illustrative numbers. High CSAT renews at 92 percent. Low CSAT at 80 percent. Uplift is 12 points. With 2,000 accounts, 3,000 euro average revenue, and 70 percent gross margin, the annualized revenue impact is 0.12 x 2,000 x 3,000 x 0.70 which equals 504,000 euro. If escalations drop from 8 percent to 5 percent and each costs 40 euro, the annualized saving is 0.03 x 2,000 x 40 which equals 2,400 euro.
Data to join
Link CSAT responses to customer IDs with timestamps and touchpoints. Pull revenue outcomes from your CRM and cost outcomes from your support and finance systems. Keep the banding and windows stable so month to month comparisons hold.
FAQ about CSAT
What is a good CSAT
Scores vary by industry and channel. Track your own baseline, then set targets by touchpoint. Focus on trend and driver insights more than a single number.
How many responses do I need in a CSAT survey
As a rule of thumb, a few hundred responses per touchpoint give stable trends. Start smaller if needed and expand.
Should I always count top two boxes as satisfied in a CSAT survey
Yes for 1 to 5 and 1 to 7 scales. Keep the rule stable over time so your trend is comparable.
Can I send CSAT to all customers
Target moments of truth to reduce fatigue and raise response rate. Use sampling on high volume flows.
Can CSAT surveys be used to prove ROI of growing customer satisfaction?
Yes, CSAT surveys are often used to prove ROI of various business outcomes and of increased customer satisfaction. Questback offers several solutions where we compare renewal, expansion, or repeat purchase across CSAT segments. You can also quantify cost savings from fewer escalations as CSAT rises.
How is CSAT used to drive ROI?
What gets measured gets managed. CSAT surveys are used to put the spotlight on what needs to get managed that includes a customer satisfaction aspect. Positive ROI come when you measure, diagnose, fix and verify whatever the CSAT survey measures.
Try Questback
Questback is a leading Customer and Employee Experience solution that makes it easy to collect, analyse and take action on key stakeholder insights.