Getting started with the NPS question – a complete guide

Net Promoter Score (NPS) is a metric between -100 and 100 that measures customer loyalty. Research shows a strong correlation between a company’s NPS and customer loyalty. What’s more, research also suggests a relationship between NPS and sales growth. Given its strategic importance, your business must measure its NPS. This guide shows you how.
While your NPS is a single metric, it’s vital to get it right. Done well, its measurement will reward you with valuable, actionable insights to grow your business. This guide walks you through NPS’s measurement and interpretation, including our NPS calculator. We also share case studies to demonstrate what a good NPS looks like. Importantly, we also highlight when and how to measure your NPS best.
Table of Contents
Try Questback 14 days for free.
Why is the NPS a valuable metric?
The NPS is remarkably popular, given its widespread use. For instance, two-thirds of Fortune 1000 businesses use the NPS; it is also widely used by micro, small and medium-sized businesses. But why is NPS so popular? For
- Effective Benchmarking: NPS measurements provide both internal and external benchmarks. Internally, they provide a solid comparison of customer loyalty over time. Likewise, due to their popularity, the data exists that allows you to benchmark your loyalty against competitors.
- Value in Simplicity: While no single metric is perfect, some better capture more information than others. Just like a financial statement’s Net Income metric, the NPS conveys a lot of valuable information— customer loyalty is the lifeblood of any business.
- Rapid Insights: If you place your NPS on your KPI dashboard and continuously track its score, you’ll benefit from rapid insights that you can act upon quickly. In brief, when you measure NPS, you can continuously monitor and improve customer satisfaction.
- Predictive Power: NPS, as with other customer metrics, holds predictive power. As mentioned at the outset, as its focus is customer loyalty, it unsurprisingly can predict sales growth.
What is the NPS question?
The NPS question is a single item, usually worded as:
How likely is it that you would recommend [Organisation] to a friend or colleague?
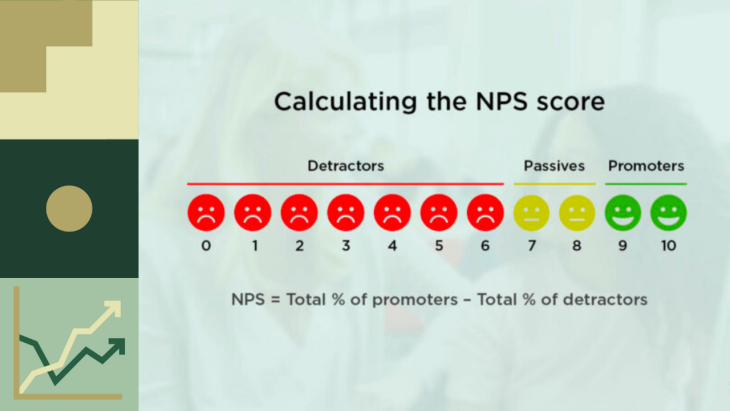
The respondent is offered a scale from 0 to 10, with 0 being not at all likely and 10 extremely likely.
Responses are grouped in three groups according to:
- Ratings between 0 and 6 are considered detractors
- Ratings between 7 and 8 are considered passives
- Ratings between 9 and 10 are considered promoters
How is the NPS score calculated?
Based on these groups, the NPS is calculated like this:
((Number of promoters – Number of detractors) / Total responses ) x 100
The formula is sometimes also written as (which gives the same result):
Total % of promoters – Total % of detractors
At Questback, we recommend complementing the Net Promoter question with an open text input—this encourages the respondent to explain their rating. Qualitative feedback not only adds valuable context but will also help you identify the best means to improve your score. Moreover, to gain the most value, provide a conditional question that prompts the rationale behind their specific score. For example, “Please tell us more about why you wouldn’t recommend [Organisation]’ ). When you provide a guided prompt, this often increases the number of explanatory responses.
Try a demo NPS survey made for ‘Petstore’ with Questback
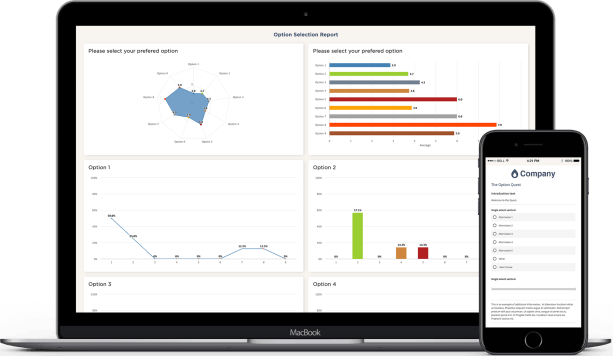
View an example NPS report for ‘Petstore’ in Questback
NPS Calculator
Calculate your NPS®
Add your number of detractors, passives and promoters in the boxes below
You can use our net promoter score calculator to try different detractor, passive, and promoter combinations. Note how these changes affect an NPS score.
Example calculations of NPS
It’s essential to understand how the NPS differs from your typical metric. While the NPS 11-point scale ranges from 0 to 10, its calculation method places specific weight on your most loyal customers. This method permits different sensitivity to detractors, passives, and promoters as it only deems answers 9 and 10 as real promoters while all answers between 0 and 6 are considered to have an active risk of churning/showing very low loyalty.
Let’s look at a couple of example NPS surveys and their outcome:
| 0-6 (detractors) | 7-8 (passives) | 9-10 (promoters) | Total responses | Calculation | NPS |
| 20 | 12 | 10 | 42 | ((10-20)/42) x 100 | -23 |
| 20 | 20 | 20 | 60 | ((20-20)/60) x 100 | 0 |
| 10 | 8 | 20 | 38 | ((20-10)/38) x 100 | 26 |
From these example calculations, we can learn a couple of exciting things.
- If you have more detractors than promoters, you will have a negative NPS (and with more promoters than detractors, you will have a positive score)
- The number of passives does not affect whether you get a positive or negative NPS – but it will either lower your total if you have a positive NPS or increase it if it is negative. In this way, passives act like a sort of ‘damper’ on your score. You can see this by experimenting with increasing or lowering the number of passives in the examples above (since passives are not included in the NPS calculation, their effect is only to increase the number of total responses used in the calculation).
- If you have equal detractors as promoters, your NPS will be 0 no matter how many passives you have.
- Getting a high NPS requires many promoters. Even a handful of detractors can dampen a potentially high NPS.

How to Improve Your NPS Throughout the Customer Journey
Do you want to create an excellent customer journey with ongoing NPS measurement? Gain competitive advantages, increase profits, and improve your customer satisfaction?
NPS benchmarks
NPS is a standardised question that allows comparisons between products, companies, countries, or other entities. This is the core reason why the NPS question should be kept as close as possible to the exact wording in all instances—both between individual company surveys and between different company surveys—to allow internal and external benchmarking, respectively.
Nonetheless, there isn’t a universal benchmark for NPS. As you would expect, the Net Promoter Score varies significantly between industries, types of products, and services. It also varies with how and when the question is asked.
With our experience at Questback, we see a significant impact on the Net Promoter Score if it is measured:
- Close to a recent interaction with an employee of the organisation.
- Close to a positive experience as compared to a negative experience.
- Event/trigger-based or recurring (such as annual), where the response rate score is usually positively correlated with the recency of interaction with the company.
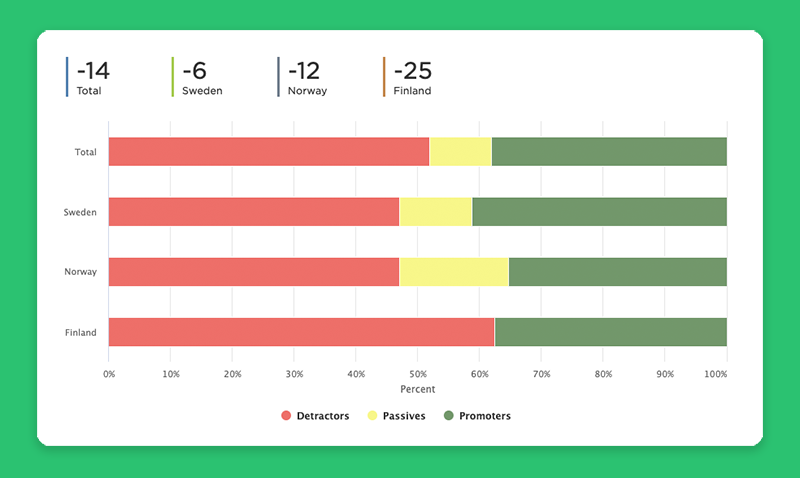
The best benchmark for the Net Promoter Score is your organisation. At Questback, we always recommend measuring continuous or touchpoint NPS, where you collect a trend of answers that can be followed over time. This way, you can get an overview of the current state of things while seeing the impact of actions to improve your NPS over time. It is also possible to compare your NPS between different countries, departments, products, and so on and create internal company NPS targets to strive for.
External benchmarks across competitive industries (such as insurance, retail, and e-commerce) often see NPS above 50, while more complex service deliveries, such as hotels and IT services, experience lower scores between 30 and 50. Very few industries, however, report benchmarks below 0. Again, we also need to consider the reality that companies with very low scores aren’t willing to share their data, which skews NPS upwards.

What is a good Net promoter score?
Despite the complexity of comparing NPS between companies, it’s obviously better to have a high NPS than a low one. While every organisation wishes that all customer interactions attract a 10 rating, in reality, this is extremely rare—you cannot realistically expect an NPS of 100. Equally, a -100 NPS score is incredibly rare—taking away a score of 100 requires only one answer between 0 and 8 while getting a -100 score only requires that no one give a rating above 6.
While NPS benchmarking reports can easily be searched for or bought, a word of advice is to put only a little effort or focus on the NPS scores of other organisations. Instead focus more on internal benchmarking between different business functions, teams, branches, etc. That’s because the main point of measuring should always be to take action on the results – and this you can do without turning to external benchmarks. The NPS metric also provides valuable insights as to whether you are over or under-optimising. These insights will let you know whether you should focus on other areas of improvement if you reach an NPS score above 70 or double down on your efforts if you are below 30.
Try Questback 14 days for free.
Combining the NPS question with a free text input
While your NPS question gives you a metric to work with, communicate with, and to push initiatives toward improvement, an open text question, as mentioned earlier, can help you improve your NPS.
Instead of guessing, most organisations follow up the NPS question with a free text input to let their respondent add some context to their answer. When analysing your results, this is often where the real magic happens.
By splitting up free text answers between answers from detractors, passives, and promoters, it is often easy to spot trends in answer sets, both small and large. If you have big answer sets and perhaps even in multiple languages, you can use automated text analysis or word clouds to detect themes. However, often, the real value lies in the individual answers, providing insights into your customer’s world that you rarely access otherwise.
How to get representative NPS results
Sound NPS results require you to ensure that you collect answers from the right audience and that this audience represents your general audience.
One way to negatively skew your results is to be overly selective about who receives the survey or to underrepresent specific groups unintentionally.
The most common cause of a misrepresentative NPS is allowing manual respondent selection. It’s easy to see how this could happen. Imagine a customer support representative after a difficult exchange. If left to choose, it’s unlikely the rep will send a survey. In contrast, when you use an automated solution, such as Questback, you easily avoid risking a skewed dataset.
The unintentional way of misrepresentation is often connected to how the NPS question is distributed. When we don’t offer a mobile experience to collect answers, e.g., using SMS, we inadvertently skew the results by under-representing, for example, younger people.
When to measure Net Promoter Score
There are three different occasions when you should measure NPS:
- Touchpoint/trigger-based is when a Net Promoter Score survey is sent as the result of an event, such as the customer making a purchase, completing a support case, or becoming a customer.
- Recurring where many organisations choose to track their NPS every 6 months or annually. This way, it is possible to follow a trend and look at the impact of actions taken to improve the NPS.
- Ad-hoc where a firm makes ad-hoc measurements of NPS with a specific group of customers or maybe because there is no recurring process of NPS measurement active at the moment.
All three methods of triggering an NPS survey have different pros and cons, but some things can be said more generally:
- If you trigger an NPS survey around a customer interaction, you will get a higher response rate. When the interaction is fresh in the customer’s mind, it is also easier to give a well-balanced rating.
- Recurring NPS surveys are great for tracking the NPS over time, but they create the risk of survey fatigue among respondents and should, therefore, either be used sparingly to customer samples at a time or with a longer time interval (at least six months).
- Ad-hoc NPS surveys are often done with a clear purpose. However, make sure they don’t become rare events. If they do, you risk losing traction with your customers.
Read more about Net promoter score detractors in our blog.
Touchpoint and trigger-based NPS surveys can also measure a company’s Net Promoter Score. At Questback, we recommend diverse touchpoints, including:
- Customer service. This isoften in connection with a final case resolution.
- Sales meetings. NPS is triggered to evaluate the meeting as well as how it affected the general impression of the company.
- Product . A product NPS can be used to measure loyalty towards a product as compared to the company.
- Post-purchase. Often the most common one we see today after completing a purchase in a store.
Taking NPS triggered responses
Your NPS score, in itself, is just a number. Its utility starts, however, when you track NPS over time and can see changes based on actions or internal conditions. For instance, it is not uncommon to see a lower NPS as a result of longer wait times in customer support when staffing is low. When you solve this problem, you’ll likely see NPS spike upwards.
Including the NPS question in other surveys
When we add this short, easy to understand NPS question to other surveys, it helps us to interpret answers. Therefore, the NPS question is a low-effort way of adding valuable data to other surveys such as a yearly customer survey, a churn survey, or a win/loss survey to a sales prospect.
Scientific foundation of the Net Promoter Score
The NPS question was originally created to find a single question that considered the full customer experience while clearly indicating overall satisfaction. What’s more, they sought out a question that strongly correlated with customer loyalty and company profitability.
After over two years of research, Fred Reichheld concluded that asking about willingness to recommend to a friend or colleague did just that, and thus the NPS question was born. In many places, the question replaced complex surveys with one simple metric that could be used to optimise the business towards profitability.
For a more extensive history of Net promoter score, please read our article ‘a brief history of NPS‘.
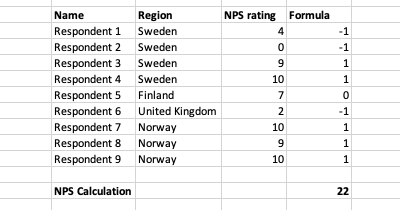
Pro tip: calculating NPS in Excel
Here is a neat little trick known to few – it is relatively easy to calculate NPS based on raw data of answers between 0 and 10, and you only need one smart formula. In Excel, it would look like this:
=IF(CELLVALUE < 7, -1, IF(CELLVALUE > 8, 1, 0))
This formula gives you a value of either -1, 0, or 1 where CELLVALUE refers to the cell where you have the raw data of the respondent’s answer (a rating between 0 and 10). To get your NPS from a group of answers, you simply use the SUM() operation to add up all the answers your formula has created and divide this value by the total number of answers and multiply by 100. This way, you can easily calculate NPS in a Pivot table, for example.
FAQ
The NPS can be calculated in two ways:
1. ((Number of promoters - Number of detractors) / Total responses ) x 100
2. Total % of promoters - Total % of detractors
Where Promoters have been rating 9 or 10, passives 7 or 8, and detractors between 0 and 6.
You can use the following formula to calculate NPS in Excel:
=IF(CELLVALUE < 7, -1, IF(CELLVALUE > 8, 1, 0)) and thereafter sum the values using =SUM() and then divide by the number of answers.
There are different types of situations when NPS could be used:
- Touchpoint/trigger-based: when an event occurs, for example if a customer makes a purchase or completing a support case.
- Recurring: measure on a regular frequency through, for example, email.
- Ad-hoc: it is possible to make ad-hoc measurements of NPS to a specific group of customers or just in the absence of recurring.
Beyond the complexity of comparing Net Promoter Score between companies, it can, however easily be said that a high NPS is better than a low one. One could wish for all interactions to garner a 10 rating by the customer, but we do know that this in reality is extremely rare and it is hard to realistically expect an NPS of 100 for a company. The best way is to compare with industry-standard NPS or your previous NPS and how you could improve it over time.
In Net Promoter Score (NPS), a negative score indicates that there are more detractors (customers who gave a score of 0-6) than promoters (customers who gave a score of 9-10). A negative score suggests that there are significant issues in the customer experience, and customers are not satisfied with the company's products or services.
While a negative score in NPS is not desirable, it can still provide valuable information for the company to make improvements in the customer experience. The company should focus on identifying the reasons for the negative score and addressing the underlying issues that are causing dissatisfaction among customers.
It's important to note that NPS scores can vary widely between industries and companies, and what's considered a good score for one company may be different for another. However, in general, a negative NPS score is considered a warning sign that the company needs to take immediate action to improve the customer experience and increase customer satisfaction.
In Net Promoter Score (NPS), a zero result indicates that the number of detractors (customers who gave a score of 0-6) is equal to the number of promoters (customers who gave a score of 9-10). This means that the company has an equal number of customers who are satisfied and those who are dissatisfied.
While a zero result may not necessarily be bad, it's also not necessarily good. Ideally, companies should aim to have a higher number of promoters than detractors, resulting in a positive NPS score. However, a zero NPS score can be a starting point for improvement, as it shows that the company has work to do to improve customer satisfaction and loyalty.
It's important to note that NPS is just one metric and should be used in conjunction with other metrics and customer feedback to get a complete picture of how well a company is meeting its customers' needs.
In Net Promoter Score (NPS), a score of 20 indicates that the company has more promoters (customers who gave a score of 9-10) than detractors (customers who gave a score of 0-6). While a score of 20 is not as high as a score of 10, it's still considered a good score.
A score of 20 in NPS means that the company has a relatively high level of customer satisfaction and loyalty, which can lead to increased customer retention and positive word-of-mouth advertising. However, there is still room for improvement, and the company should continue to focus on providing excellent customer service and experiences to increase its NPS score over time.
It's important to note that NPS scores can vary widely between industries and companies, and what's considered a good score for one company may be different for another. The most important thing is to consistently monitor and track the NPS score and use customer feedback to make improvements to the customer experience.
In Net Promoter Score (NPS), a score of 30 is considered a good score. This score indicates that the company has a higher number of promoters (customers who gave a score of 9-10) than detractors (customers who gave a score of 0-6), but there is still room for improvement.
A score of 30 in NPS means that the company has a relatively high level of customer satisfaction and loyalty, which can lead to increased customer retention and positive word-of-mouth advertising. However, the company should continue to focus on improving its NPS score by identifying areas for improvement in the customer experience and making changes to address them.
It's important to note that NPS scores can vary widely between industries and companies, and what's considered a good score for one company may be different for another. The most important thing is to consistently monitor and track the NPS score and use customer feedback to make improvements to the customer experience.
In Net Promoter Score (NPS), a score of 40 is considered a very good score. This score indicates that the company has a significantly higher number of promoters (customers who gave a score of 9-10) than detractors (customers who gave a score of 0-6).
A score of 40 in NPS means that the company has a high level of customer satisfaction and loyalty, which can lead to increased customer retention, positive word-of-mouth advertising, and business growth. The company should continue to focus on providing excellent customer service and experiences to maintain its high NPS score and further improve its customer loyalty.
It's important to note that NPS scores can vary widely between industries and companies, and what's considered a good score for one company may be different for another. However, a score of 40 is generally considered a very good score and an indicator of a company's strong relationship with its customers.
In Net Promoter Score (NPS), a score of 50 is considered an excellent score. This score indicates that the company has a significantly higher number of promoters (customers who gave a score of 9-10) than detractors (customers who gave a score of
In Net Promoter Score (NPS), a score of 60 is considered an exceptional score. This score indicates that the company has a significantly higher number of promoters (customers who gave a score of 9-10) than detractors.
In Net Promoter Score (NPS), a score of 70 is an outstanding score. This score indicates that the company has a significantly higher number of promoters (customers who gave a score of 9-10) than detractors (customers who gave a score of 0-6).
A score of 70 in NPS means that the company has a very high level of customer satisfaction and loyalty, which can lead to increased customer retention, positive word-of-mouth advertising, and business growth. The company is likely doing an exceptional job of meeting its customers' needs and exceeding their expectations.
It's important to note that NPS scores can vary widely between industries and companies, and what's considered a good score for one company may be different for another. However, a score of 70 is generally considered an outstanding score and an indicator of a company's exceptional relationship with its customers. The company should continue to focus on maintaining its high NPS score and further improving its customer loyalty.
In Net Promoter Score (NPS), a score of 80 is an very exceptional score. This score indicates that the company has a significantly higher number of promoters (customers who gave a score of 9-10) than detractors (customers who gave a score of 0-6).
A score of 80 in NPS means that the company has an extremely high level of customer satisfaction and loyalty, which can lead to increased customer retention, positive word-of-mouth advertising, and business growth. The company is likely doing an outstanding job of meeting its customers' needs and exceeding their expectations.
It's important to note that NPS scores can vary widely between industries and companies, and what's considered a good score for one company may be different for another. However, a score of 80 is generally considered an exceptional score and an indicator of a company's exceptional relationship with its customers. The company should continue to focus on maintaining its high NPS score and further improving its customer loyalty.
In Net Promoter Score (NPS), a score of 90 is an very outstanding score. This score indicates that the company has a significantly higher number of promoters (customers who gave a score of 9-10) than detractors (customers who gave a score of 0-6).
A score of 90 in NPS means that the company has an exceptionally high level of customer satisfaction and loyalty, which can lead to increased customer retention, positive word-of-mouth advertising, and significant business growth. The company is likely doing an exceptional job of meeting its customers' needs and exceeding their expectations.
It's important to note that NPS scores can vary widely between industries and companies, and what's considered a good score for one company may be different for another. However, a score of 90 is generally considered an outstanding score and an indicator of a company's exceptional relationship with its customers. The company should continue to focus on maintaining its high NPS score and further improving its customer loyalty.
In Net Promoter Score (NPS), a score of 100 is the highest possible score and represents an exceptional achievement. This score indicates that the company has only promoters (customers who gave a score of 9-10) and no detractors (customers who gave a score of 0-6).
A score of 100 in NPS means that the company has an exceptionally high level of customer satisfaction and loyalty, which can lead to increased customer retention, positive word-of-mouth advertising, and significant business growth. The company is likely doing an outstanding job of meeting its customers' needs and exceeding their expectations.
It's important to note that NPS scores can vary widely between industries and companies, and what's considered a good score for one company may be different for another. However, a score of 100 is generally considered an exceptional score and an indicator of a company's exceptional relationship with its customers. The company should continue to focus on maintaining its high NPS score and further improving its customer loyalty.
nps stands for Net Promoter Score.
Read more in our guide!
100 is the best score in NPS. You get it if everybody gives you a 10 out of 0-10.
You should not as to often if a customer would recommend you. Choose your touchpoints and how often carefully to avoid survey fatigue
Calculate your NPS by either:
1. ((Number of promoters - Number of detractors) / Total responses ) x 100
2. Total % of promoters - Total % of detractors
Where Promoters have been rating 9 or 10, passives 7 or 8, and detractors between 0 and 6.
Each organization chooses if they want to make their NPS score public.
It makes sense to make a great score public, meanwhile, a low score gives the organization fuel to work on the customer experience to improve their score.
Try Questback
Questback is a leading Customer and Employee Experience solution that makes it easy to collect, analyse and take action on key stakeholder insights.